Why it matters
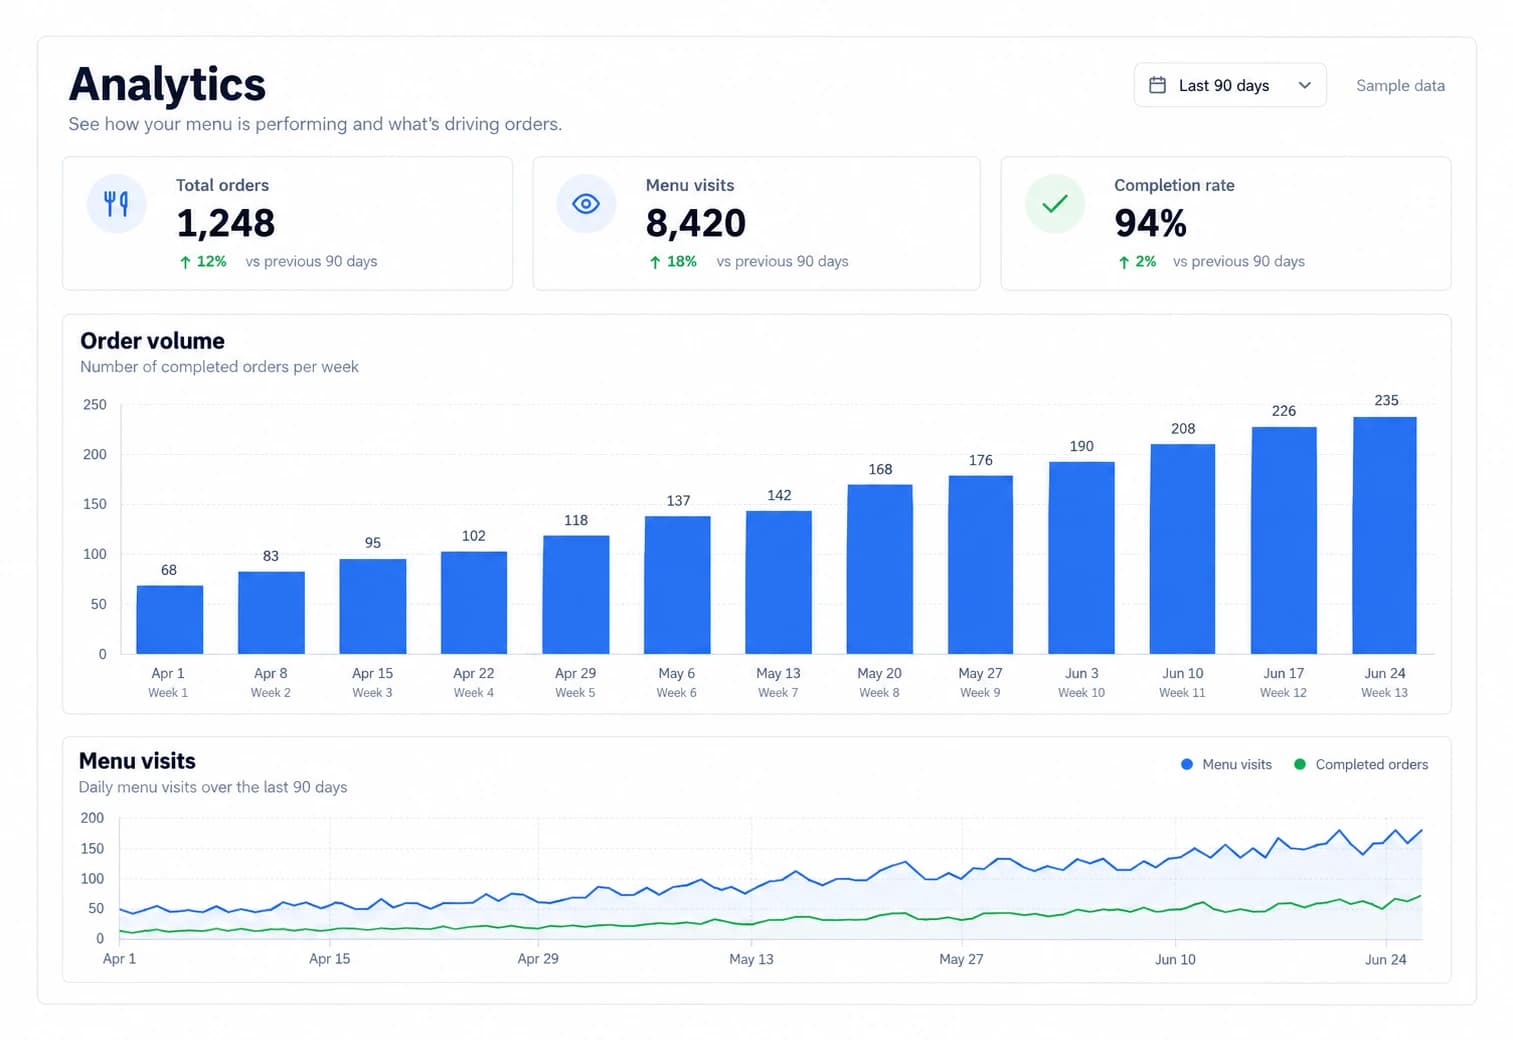
The Analytics page goes beyond the dashboard summary. Choose a menu-visit window and compare traffic with the previous period, then review daily order volume and completion rate. These operational reports complement your restaurant’s own accounting and financial reports.
What you get
7-, 30- or 90-day menu visit windows
Visit comparison with the previous period
Daily order volume chart
Order completion rate
How it works
01
Open Analytics
Move from your dashboard summary to the activity reports.
02
Select a period
Choose the menu-visit window and order period independently.
03
Review the trends
Compare visits with the previous period and follow order volume and completion.
Explore this group — Run your operation
Ready to put this to work?
Start with the free plan and turn it on in minutes.
Start Free